Property Details

(Property Sold)

Investment property: Lilburn, GA 30047
(Click on photo for more information)

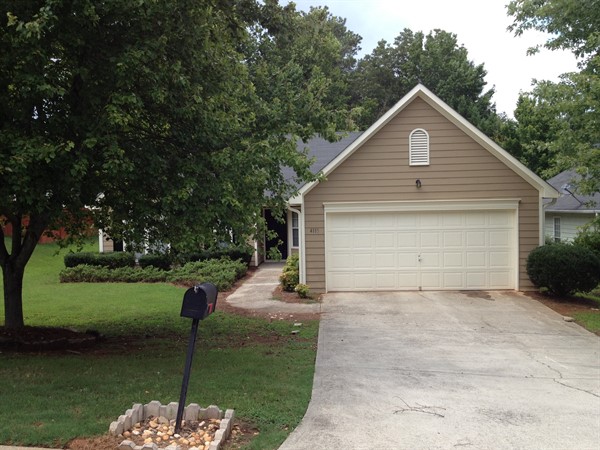
Open ranch style home with living room, dining room, 2 car garage.Great school district. Home foreclosed in 2012 for $142,354.

Address 4115 Landress Park Drive NW
Lilburn, GA  30047
County Gwinnett
Year Built 1994
Subdivision
Bedrooms 3
Bathrooms 2
SqFt 1551
Stories 2
Garage

Price $ 109900
Estimated Repairs $ 25000
Estimated Retail Value $ 109900
Estimated Rental Income $ 1100
Estimated Property Taxes $ 1929
HOA Fees $ 0

Get Directions To This Property >

Financial Evaluator For This Property >

Print Property Details >

Print a flyer For This Property >

Property Photos


Before

After

Comps


Address 315 Tambec Trace NW
Lilburn, GA 30047

5 BR / 3 BA
2492 Sq. Ft.
Last Sold On: 04/24/2012

Sales Price: $120,001

Address 155 King David Drive
Lilburn, GA 30047

3 BR / 2 BA
2077 Sq. Ft.
Last Sold On: 05/25/2012

Sales Price: $124,000

Address 537 Daisy Nash Drive
Lilburn, GA 30047

4 BR / 2.5 BA
3060 Sq. Ft.
Last Sold On: 03/01/2012

Sales Price: $120,000

Address 4128 Linda Lane
Lilburn, GA 30047

4 BR / 2.5 BA
2577 Sq. Ft.
Last Sold On: 05/09/2012

Sales Price: $120,000

Address 422 Ben Ave
Lilburn, GA 30047

3 BR / 2 BA
1708 Sq. Ft.
Last Sold On: 05/31/2012

Sales Price: $118,000


Basic Purchase Information

Estimated Property Value $
Purchase Price $
Down Payment (%) $
Equity at Purchase $

Cash at Closing

Loan Amount $
Down Payment (%) $
Closing Costs (%) $
Total Cash Required
at Closing *
$
* This total does not include potential
escrow reserves for taxes & insurance

Mortgage Calculations

Loan Amount: $, Loan Term: yrs, Interest Rate: %
Mortgage Payment $
Mortgage Payment (Yearly) $

Financial Performance Summary

Cash on Cash Return
(Year 1)
Cap Rate (Year 1)
Total Equity at Year 5 $
Projected Monthly Cash Flow $

Assumptions for Calculations (Annual)

Gross Scheduled Income (Monthly) $
Mortgage Interest Rate (%)
Mortgage Down Payment (%)
Mortgage Loan Term (Fixed)
Property Taxes $
Insurance $
Homeowners Association (Yearly) $
Property Management Fee (%)
Maintenance Reserve (%)
Appreciation Rate (%)
Vacancy Allowance (%)
Rental Income Increase (%)
Property Tax Increase (%)
Closing Costs (Purchase) (%)
Closing Costs (Sale) (%)

Cash Flow and Equity Accumulation

CASH-FLOW MONTHLY YEAR 1 YEAR 2 YEAR 3 YEAR 4 YEAR 5 YEAR 10 YEAR 20 YEAR 30
Gross Scheduled Income
Vacancy Allowance
Total Operating Income
Property Taxes
Insurance
Homeowners Association
Maintenance Reserve
Property Management
minus Total Operating Expenses
Net Operating Income
minus Mortgage Expense
GROSS CASH FLOW
Plus Principle Paydown
Plus Yearly Appreciation
EFFECTIVE NET CASH FLOW
 
EQUITY ACCUMULATION YEAR 1 YEAR 2 YEAR 3 YEAR 4 YEAR 5 YEAR 10 YEAR 20 YEAR 30
Property Value
(Mortgage Balance)
EQUITY (WEALTH)
 
TAX BENEFIT YEAR 1 YEAR 2 YEAR 3 YEAR 4 YEAR 5 YEAR 10 YEAR 20 YEAR 30
Depreciation
Mortgage Interest

Want to learn how we’ve flipped over 700 properties in Metro Atlanta?!


Register here for our upcoming free real estate investing workshop

Register

Enter your Email here to be added to our preferred buyers list


Add Me
View Our Properties Online